Alerts that name the cause
“Battery 1 at 14 %, charging did not start at 09:10; at this rate the critical threshold falls around 16:00.” A sentence you can act on, with the reason inside it.
Hestia reads a solar installation continuously — panels, inverter, batteries cell by cell, transfer switch, mains meter — keeps the history, and turns it into what a human actually needs: a level, an explanation, and a prediction of what happens next.
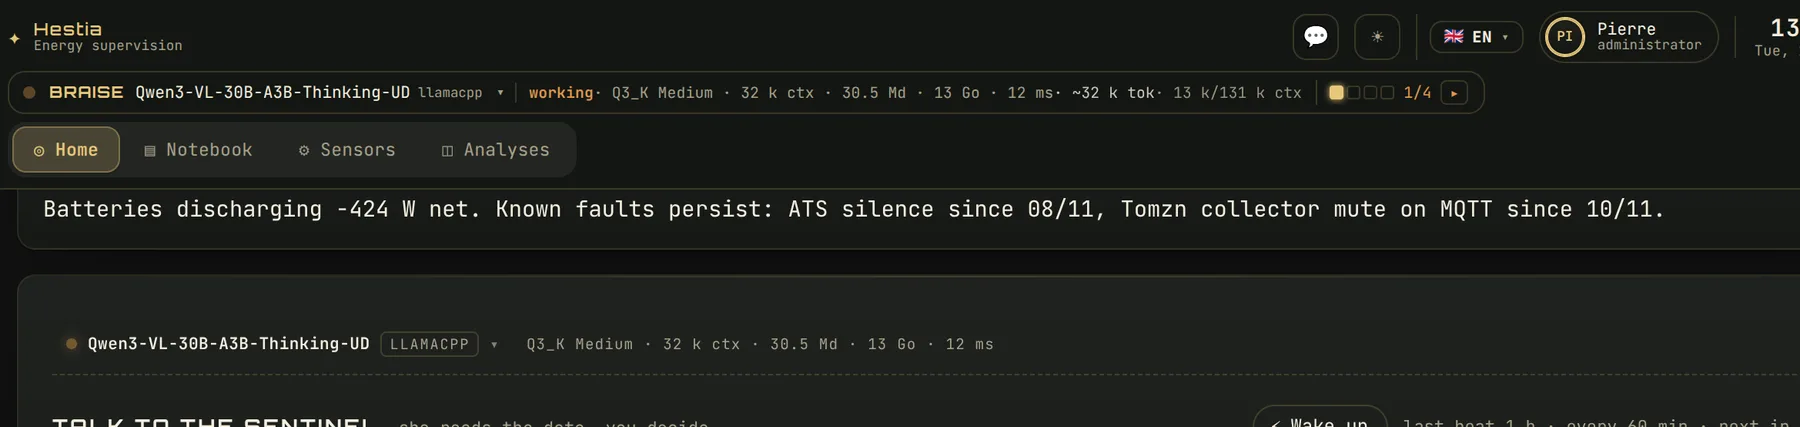
The energy chain, the state of every source, the batteries cell by cell — and, in the corner, the sentinel's own reading of the situation in a sentence.
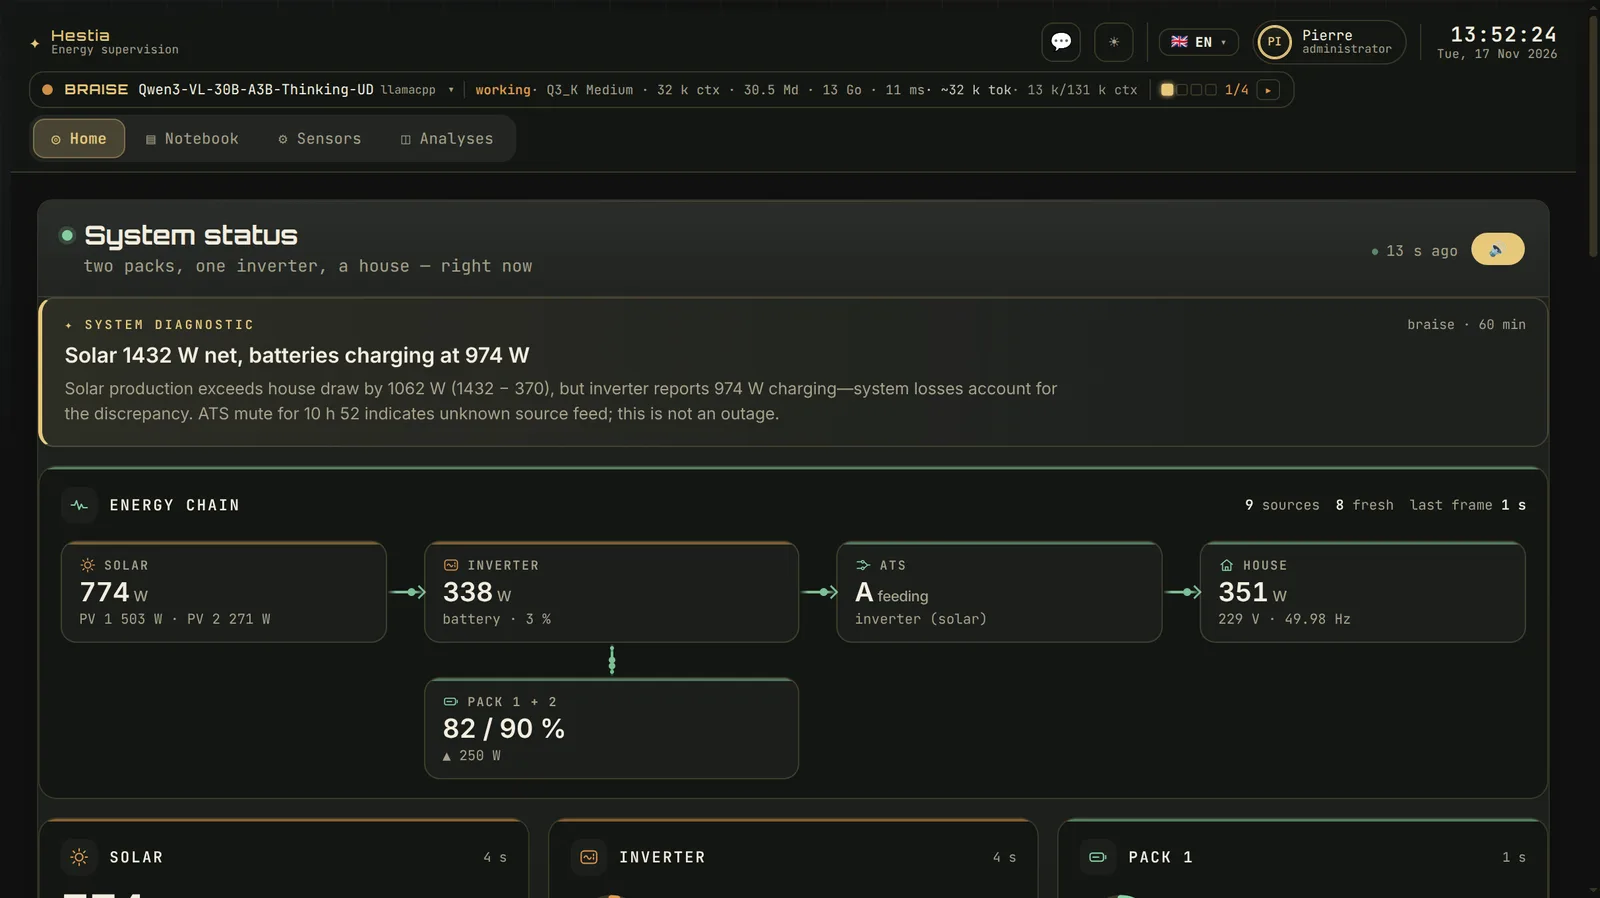
An inverter already displays its own figures. What it does not do is remember them, compare them across weeks, notice that one cell drifts, and warn you at five in the morning that the reserve will cross the critical threshold at four in the afternoon — while there is still time to act.
Hestia is that layer: continuous acquisition, a long history, per-cell diagnostics, and an agent that answers questions in words.
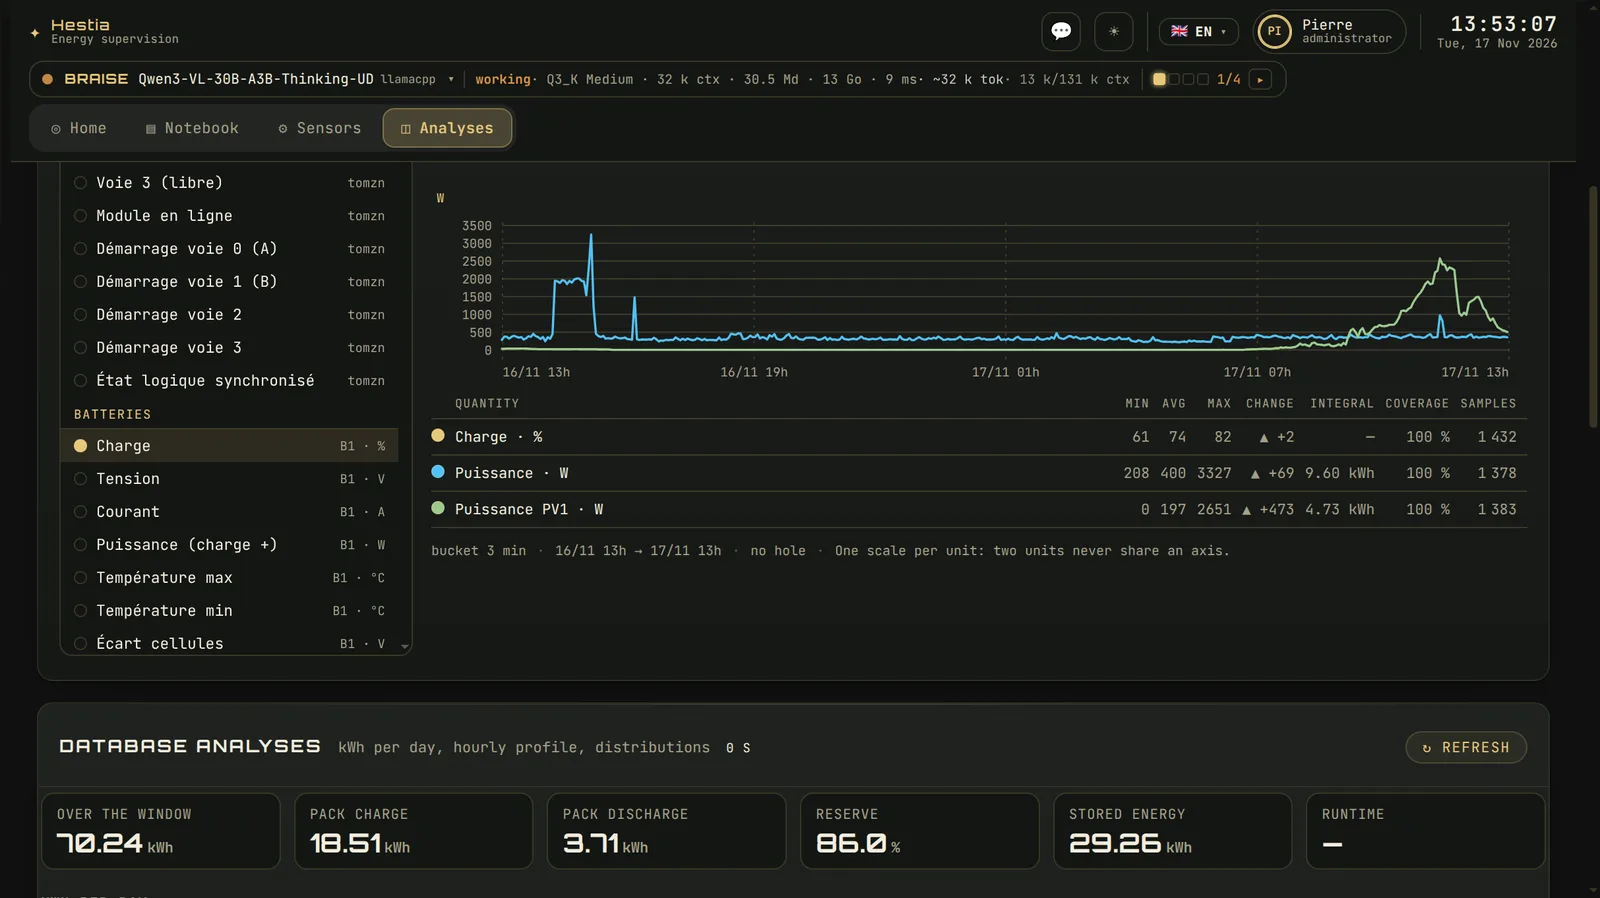
Energy consumed over the window, what went into the packs and what came out, remaining reserve, stored energy, estimated runtime — and the daily shape of the house. The figures below are read from the live base, not typed into a slide.
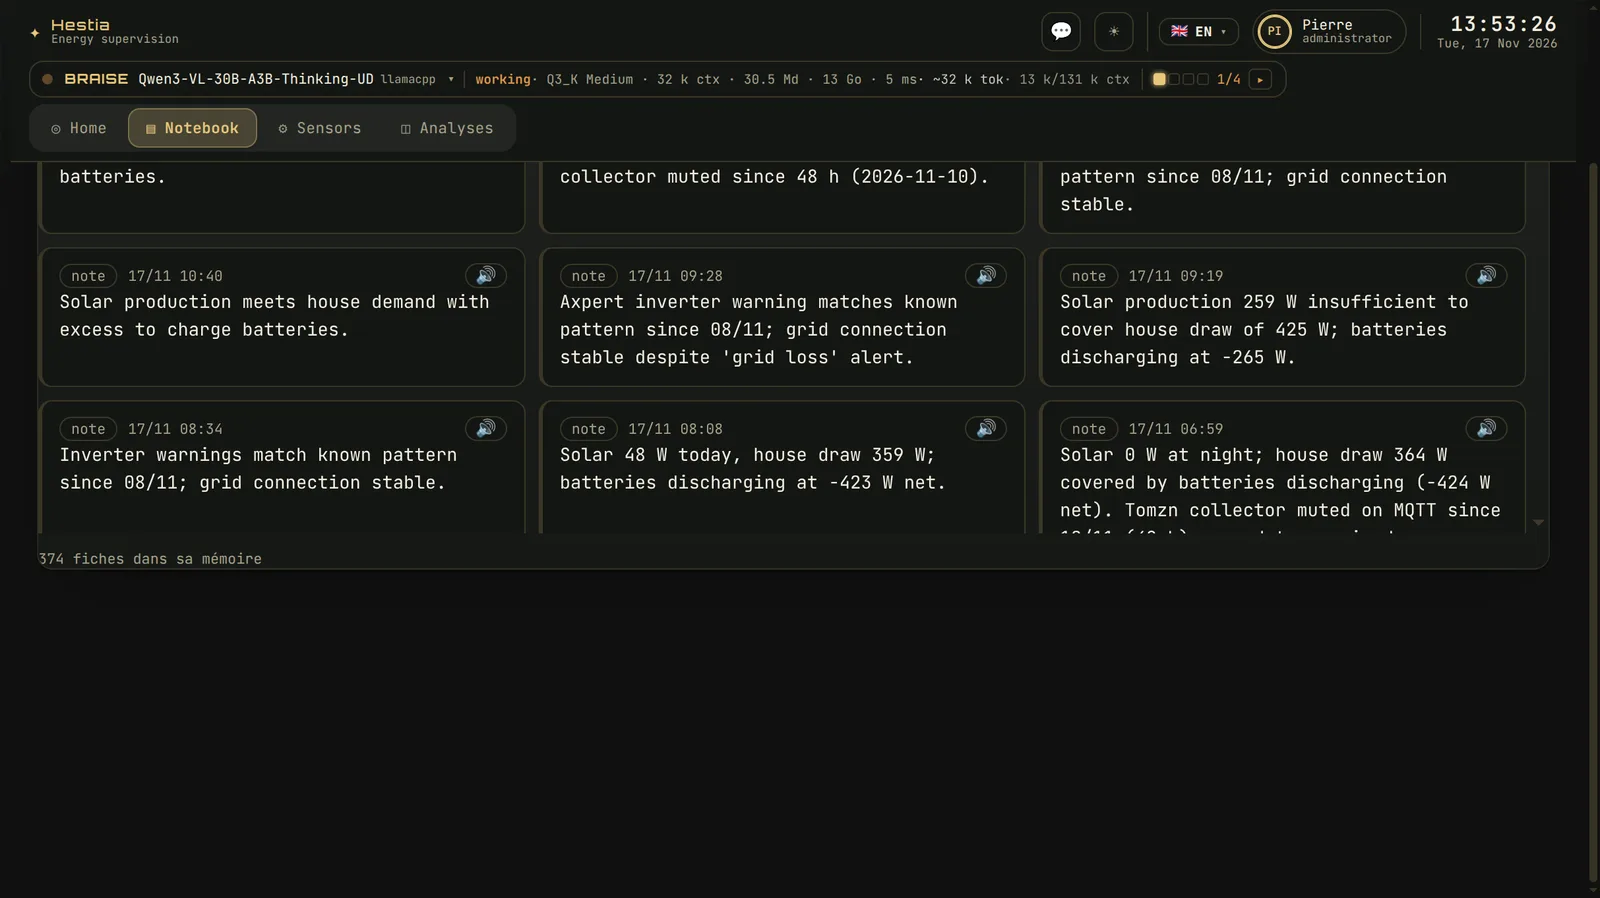
Every time the sentinel takes stock of the installation, it writes the result down — a dated entry it can read back tomorrow, next week, or when a question is asked. The journal is not a log of raw numbers; it is the interpretation: what the solar did, whether the batteries are balanced, what deserves attention.
Reports and experience accumulate separately — the routine observations from the durable lessons. Both are searchable, and both feed the next morning's summary.
“Battery 1 at 14 %, charging did not start at 09:10; at this rate the critical threshold falls around 16:00.” A sentence you can act on, with the reason inside it.
Sixteen cells per pack, each one watched: average, spread, the weakest cell and since when, abnormal resistance. A pack that is failing rarely announces it globally.
Ask the sentinel in plain language. It reads the base, states the period it used, and gives numbers — or says it does not know.
What the site produced, consumed and stored, with anomalies. Ready to send to an owner, a tenant or a client.
Designed where the grid is optional: transfer switch state, generator starts, brown-outs and recoveries are first-class events.
Energy and security in the same interface, with the same agent platform underneath — one place to look in the morning.
An installation that reports “battery 40 %” hides the only thing that matters when a pack ages: which cell is at 3.29 V while its neighbours sit at 3.31 V, and for how many days. Averaged figures are comfortable and useless.
The same holds for the reserve. “14 %” is a state; “critical at 16:00” is a decision you can still take. Hestia is built to produce the second.
Know the reserve, the weak cell, and the night that will not pass — before it does not.
Pumps, cold rooms, irrigation: the load that must not stop, and the energy that must be there.
Solar-backed sites where a silent battery is a silent site. Reports prove the state of the installation.
Consumption per line, peak detection, and a written record of what the installation did.
A pilot runs on your inverter and your batteries, with your thresholds. At the end you keep the history and the reports.